Student Achievement Data
Graduation and transfer-out rates
What is a graduation rate and what is a transfer-out rate?
Federal regulations specify how to calculate the graduation and transfer rates. The rates come from a study of Minnesota State Community and Technical College (M State) students who started at the college in the fall of 2021. The study includes all first-time students who enrolled full-time that fall and were seeking to earn a degree, diploma or certificate at the college.
- Graduation rate - The percentage of these students who graduated from M State within three years.
- Transfer-out rate - The percentage of these students who did not graduate from M State but instead transferred to another college or university within three years.
What do I need to know about these rates?
These rates do not report on all students at M State. The 551 first-time, full-time students in the study represent about 10 percent of all students enrolled at M State in fall of 2021.
What are the graduation and transfer-out rates for M State students and how do they compare to rates for other colleges?
- The graduation rate for M State was 47 percent.
- The transfer-out rate for M State was 47 percent.
- The combination of the graduation rate and the transfer-out rate for M State was 94 percent.
- The national average combined rate for similar colleges was 51 percent.
Why don't more M State students graduate or transfer in three years?
- Since M State has an "open-door" mission, many new students need to take developmental courses to improve their reading, writing or math skills before taking other college courses.
- Students who switch from full-time to part-time enrollment or "stop out" for one or more semesters are more likely to take more than three years to graduate.
- Some students take jobs before they graduate.
- Other students delay their education for personal, family or financial reasons.
| M State | Graduation Rate | Transfer-Out Rate | Combined Rate |
|---|---|---|---|
| Total Cohort | 47% | 47% | 94% |
| Race/Ethnicity | Graduation Rate | Transfer-Out Rate | Combined Rate |
|---|---|---|---|
| American Indian or Alaska Native | 25% | 50% | 75% |
| Asian | * | * | * |
| Black or African American | * | * | * |
| Hispanic of any race | * | * | * |
| Native Hawaiian or Other Pacific Islander | * | * | * |
| U.S. Nonresident | * | * | * |
| Two or more races | * | * | * |
| Unknown race and ethnicity | * | * | * |
| White | 52% | 43% | 95% |
| Gender | Graduation Rate | Transfer-Out Rate | Combined Rate |
|---|---|---|---|
| Female | 41% | 51% | 92% |
| Male | 50% | 45% | 95% |
| Financial Aid | Graduation Rate | Transfer-Out Rate | Combined Rate |
|---|---|---|---|
| Pell Grant Recipient | 38% | 54% | 93% |
| Received neither Pell nor Subsidized Stafford Loans | 53% | 42% | 95% |
| Received Subsidized Stafford Loans, but no Pell | 51% | 44% | 95% |
*Suppressed to protect student privacy. Due to rounding, percentages may not always appear to add up.
Visit Student Right to Know for more information regarding the Student Right-To-Know Act, which requires higher education institutions participating in federally funded financial aid programs to publicly disclose specific data and information.
Student persistence and completion
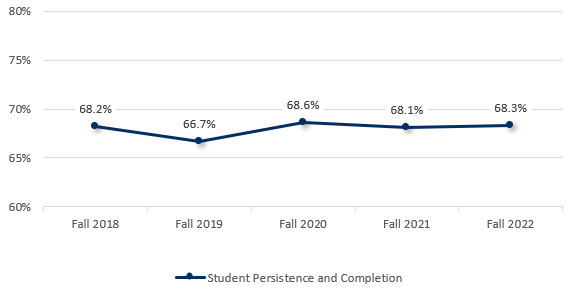
| Fall 2018 | Fall 2019 | Fall 2020 | Fall 2021 | Fall 2022 |
|---|---|---|---|---|
| 68.2% | 66.7% | 68.6% | 68.1% | 68.3% |
Percent change (end of term fall 2018 through fall 2022): 0.1%
Definition: Percent of fall entering cohort of regular and transfer students who have been retained, graduated, or transferred by the second fall term following original fall enrollment.
Completion rate
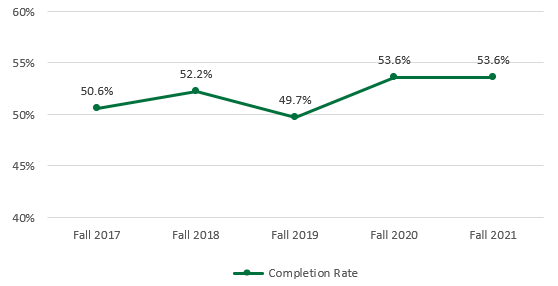
| Fall 2017 | Fall 2018 | Fall 2019 | Fall 2020 | Fall 2021 |
|---|---|---|---|---|
| 50.6% | 52.2% | 49.7% | 53.6% | 53.6% |
Percent change (end of term fall 2017 through fall 2021): 3%
Definition: Percent of entering cohort of undergraduate regular and transfer students that have completed. Completion is measured as graduation or transfer by the end of the third spring after entry at M State.
Licensure exam pass rate
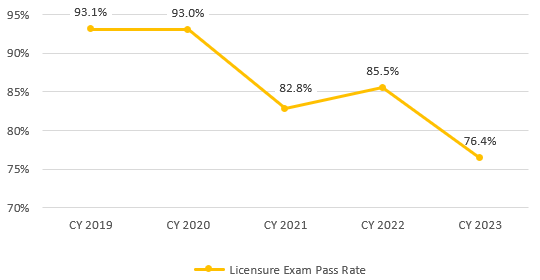
| CY 2019 | CY 2020 | CY 2021 | CY 2022 | CY 2023 |
|---|---|---|---|---|
| 93.1% | 93.0% | 82.8% | 85.5% | 76.4% |
Percent change (calendar years 2019 through 2023): -16.7%
Definition: Percent of a cohort of students or graduates that passed a state or national licensure examination. This measure is a weighted average pass rate and currently includes three licensing exams: nursing, peace officer and radiography.
Graduate placement rate
Related employment rate by award type
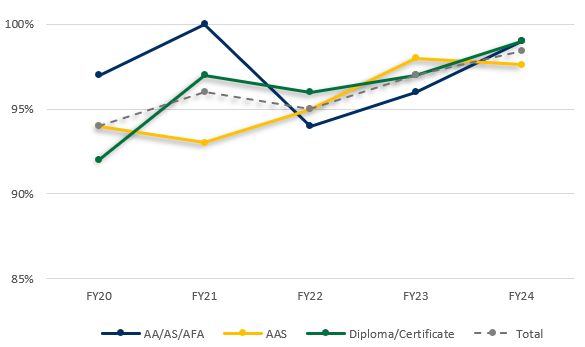
| Award Type | 2020 | 2021 | 2022 | 2023 | 2024 |
|---|---|---|---|---|---|
| AA/AS/AFA | 97% | 100% | 94% | 96% | 99% |
| AAS | 94% | 93% | 95% | 98% | 98% |
| Diploma/Certificate | 92% | 97% | 96% | 97% | 99% |
| Total | 94% | 96% | 95% | 97% | 98% |
Percent change (fiscal year 2020 - 2024): AA/AS/AFA 2%, AAS 4%, diploma/certificate 7%, total for all degrees 4%
Continuing education rate by award type
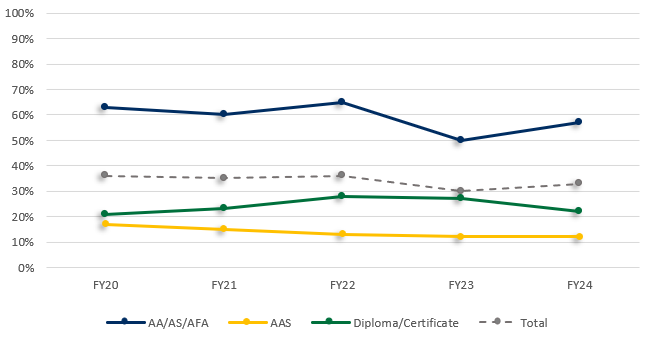
| Award Type | 2020 | 2021 | 2022 | 2023 | 2024 |
|---|---|---|---|---|---|
| AA/AS/AFA | 63% | 60% | 65% | 50% | 57% |
| AAS | 17% | 15% | 13% | 12% | 12% |
| Diploma/Certificate | 21% | 23% | 28% | 27% | 22% |
| Total | 36% | 36% | 32% | 30% | 33% |
Percent change (fiscal year 2020 - 2024): AA/AS/AFA -6%, AAS -5%, diploma/certificate 1%, total for all degrees -3%
Related employment by major
| Major | Award | 2020 | 2021 | 2022 | 2023 | 2024 |
|---|---|---|---|---|---|---|
| Accounting | AAS | 94% | 88% | 94% | 92% | 100% |
| Accounting Clerk | Diploma | 100% | 100% | 100% | 100% | 100% |
| Accounting Transfer Pathway (formerly Accounting AS) | AS | N/A | 100% | 50% | 100% | 100% |
| Administrative Assistant - Finance | Certificate | 100% | 100% | 100% | ||
| Administrative Assistant - Human Resources | Certificate | 100% | 100% | 100% | ||
| Administrative Assistant - Legal | Certificate | 100% | ||||
| Administrative Support | Diploma | 100% | 100% | 80% | 100% | 100% |
| Advanced Practice Esthiology | Certificate | 100% | ||||
| Advanced HVAC (formerly Commercial Refrigeration) | Diploma | 100% | 100% | 100% | 100% | 100% |
| American Sign Language and Deaf Studies | Certificate | 100% | ||||
| American Sign Language Studies | Certificate | 0% | N/A | N/A | 50% | N/A |
| Architectural Drafting | Diploma | 100% | 100% | 50% | ||
| Architectural Drafting and Design | AAS | 100% | 100% | 100% | 100% | |
| Art Transfer Pathway (formerly Visual Arts AFA) | AFA | 100% | N/A | N/A | 100% | |
| Autism Spectrum Disorder | Certificate | 100% | N/A | 50% | 100% | 100% |
| Automotive Service Technology | AAS | 75% | 100% | 100% | 100% | 100% |
| Automotive Service Technology | Diploma | 100% | 100% | 100% | 100% | 100% |
| Biology Transfer Pathway (formerly Biological Sciences AS) | AS | N/A | N/A | N/A | N/A | 100% |
| Business | AAS | 100% | 100% | 87.5% | ||
| Business Administration | AAS | 100% | N/A | 67% | N/A | 100% |
| Business Administration | Diploma | 100% | ||||
| Business Entrepreneurship | AAS | N/A | 100% | 100% | ||
| Business Entrepreneurship | Diploma | 100% | ||||
| Business: Marketing and Sales | Diploma | 100% | N/A | 100% | 100% | 100% |
| Business Transfer Pathway (formerly Business AS) | AS | N/A | 100% | 67% | 100% | 100% |
| Cardiovascular Technology Invasive | AAS | 100% | 100% | 100% | 100% | 100% |
| Chemistry | AS | N/A | ||||
| Child and Adolescent Therapeutic Behavioral Health (formerly Mental Health Behavioral Aide II) | Certificate | N/A | N/A | 100% | 100% | 100% |
| Cisco Networking | Certificate | N/A | 100% | 100% | 100% | N/A |
| Civil Engineering Technology | AAS | 100% | 100% | 100% | 100% | |
| Computer Programming | AAS | 100% | 100% | 67% | 100% | 100% |
| Construction Management | AAS | 90% | 100% | 100% | 100% | 100% |
| Correctional Officer | Certificate | N/A | 100% | N/A | ||
| Cosmetology | Diploma | 100% | 100% | 88% | 100% | 100% |
| Cosmetology - North Dakota | Certificate | N/A | ||||
| Criminal Justice | AS | 67% | 100% | 71% | 71% | 100% |
| Cybersecurity (formerly Network Administration and Security) | AAS | 100% | 50% | 100% | N/A | 100% |
| Cybersecurity (formerly Network Security) | Certificate | 100% | 100% | 100% | 100% | |
| Dental Assisting | AAS | 100% | 100% | 100% | 100% | 100% |
| Dental Assisting | Diploma | 100% | 100% | 100% | 100% | |
| Dental Hygiene | AAS | 94% | 100% | 100% | 90% | 100% |
| Design and Engineering Technology (formerly Drafting and 3D Technologies) | AAS | 71% | 100% | 75% | 100% | 100% |
| Diesel Equipment Technology | AAS | 93% | 80% | 100% | 100% | 100% |
| Diesel Equipment Technology | Diploma | 100% | ||||
| Digital Marketing | AAS | 67% | 100% | 100% | 75% | |
| Early Childhood | Certificate | 100% | 100% | 100% | 100% | |
| Early Childhood and Paraprofessional Education | AS | 67% | 100% | 100% | N/A | |
| Early Childhood and Education Transfer Pathway | AS | 100% | 100% | 100% | ||
| Electrical Lineworker Technology | AAS | 89% | 100% | 100% | 91% | 94.1% |
| Electrical Lineworker Technology | Diploma | 81% | 92% | 94% | 95% | 97.1% |
| Electrical Technology | Diploma | 98% | 94% | 97% | 100% | 100% |
| Engineering | AS | 100% | N/A | 100% | N/A | 100% |
| Entrepreneurial | Certificate | N | N | N | ||
| Environmental Science | AS | 100% | N/A | |||
| Esthetician | Certificate | 100% | 100% | 100% | 100% | 100% |
| Eyelash Extension Technician | Certificate | 100% | 100% | |||
| Fire Service Prep | Certificate | |||||
| Global and Intercultural Studies | Certificate | N | N | N/A | N/A | N/A |
| Graphic Design | Certificate | 100% | 100% | N/A | ||
| Graphic Design Technology | Diploma | 86% | 100% | 100% | 100% | 100% |
| Health Information Technology/Coding | AAS | 93% | 95% | 83% | 100% | 100% |
| History Transfer Pathway | AA | 100% | N/A | |||
| Human Resources | Certificate | 100% | 100% | |||
| Human Resources | AAS | 92% | 75% | 92% | 100% | 100% |
| Human Resources | AS | 100% | 100% | 100% | 100% | 100% |
| HVAC - Heating, Ventilation and Air Conditioning Technology | Diploma | 93% | 100% | 100% | 91% | 100% |
| Individual Studies | AAS | 100% | ||||
| Information Technology | AAS | 100% | 88% | 89% | 50% | 50% |
| Information Technology | AS | 100% | 100% | 100% | N/A | 100% |
| Information Technology - Database Administration | AAS | 100% | 100% | 100% | 100% | |
| Liberal Arts and Sciences | AA | 98% | 100% | 94% | 96% | 97.1% |
| Limited Scope Radiography | Diploma | 100% | 100% | 100% | 83.3% | |
| Management and Marketing (formerly Business: Management, Marketing and Sales) | AAS | 96% | 88% | 95% | 100% | 100% |
| Massage Therapy | Diploma | 80% | 100% | 100% | 100% | 100% |
| Medical Administrative Assistant | AAS | 100% | 80% | 100% | 100% | 100% |
| Medical Assistant | Diploma | 100% | 100% | |||
| Medical Coding and Insurance | Diploma | 100% | 60% | 86% | 100% | 100% |
| Medical Laboratory Technology | AAS | 75% | 100% | 100% | 100% | 100% |
| Medical Laboratory Technology | AS | 100% | N/A | |||
| Medical Office Assistant | Diploma | N/A | N/A | 0% | ||
| Medical Receptionist | Diploma | N/A | N/A | 100% | 100% | |
| Music | AFA | 0% | ||||
| Nail Technician | Certificate | 100% | 100% | 100% | 100% | |
| Nursing | AS | 100% | 100% | 100% | 98% | 100% |
| Paralegal | AAS | 50% | 67% | 50% | N/A | 66.7% |
| Payroll Specialist | Diploma | 93% | 100% | 92% | 82% | 100% |
| Phlebotomy Technician | Certificate | 100% | 100% | 100% | 100% | 100% |
| Plumbing Technology | Diploma | 100% | 100% | 100% | 100% | 100% |
| Political Science Transfer Pathway | AA | N/A | N/A | N/A | 100% | N/A |
| PowerSports Technology | AAS | 100% | 100% | 100% | 100% | 100% |
| PowerSports Technology | Diploma | 100% | 100% | 100% | 100% | 100% |
| PowerSports Technology | Certificate | 100% | N/A | |||
| Practical Nursing | Diploma | 96% | 100% | 100% | 100% | 100% |
| Pre-Professional Health | N/A | |||||
| Psychology Transfer Pathway | AA | 100% | N/A | 50% | N/A | 100% |
| Purchasing and Inventory Management | Certificate | N/A | ||||
| Radiologic Technology | AAS | 100% | 100% | 100% | 100% | 100% |
| Sports Management | AS | N/A | N/A | |||
| Surgical Technology | AAS | 100% | 100% | 94% | 100% | 100% |
| Survey Technician | Certificate | 100% | 100% | |||
| Theatre Transfer Pathway | AFA | N/A | N/A | |||
| Web Design | Certificate | 100% | 100% | |||
| COLLEGE TOTAL | 94% | 96% | 95% | 97% | 98% |
2024 data is the most recent publishable data as our graduates have one year to obtain employment prior to our surveying them to gather their employment information.
Definitions: 'N/A' graduates continuing education or not seeking related employment; 'N' program not yet developed.
Contact us
- If you have questions about the information on this page, contact ir@minnesota.edu.
- For information on services M State offers for students, alumni and employers, visit Career Services.
